Introduction
This summer brings the 2026 FIFA World Cup, the most ambitious edition of the tournament yet. For the first time, 48 teams will compete — up from 32 — spread across 12 groups in a host trio of the United States, Canada, and Mexico. The expanded field means a new knockout format as well: the top two teams from each group advance directly to the Round of 32, joined by the eight best third-place finishers, setting up a 32-team bracket before the traditional Round of 16 begins. As I have done for previous soccer tournaments, I’ve modeled and simulated the World Cup 10,000 times to generate probabilistic predictions. For the curious reader, model details, limitations, and code links appear at the end of this article.
I’ll try to update these predictions throughout the tournament, so check my Twitter/X to follow along.
World Cup 2026
Third-Place Teams: Round of 32 Advancement
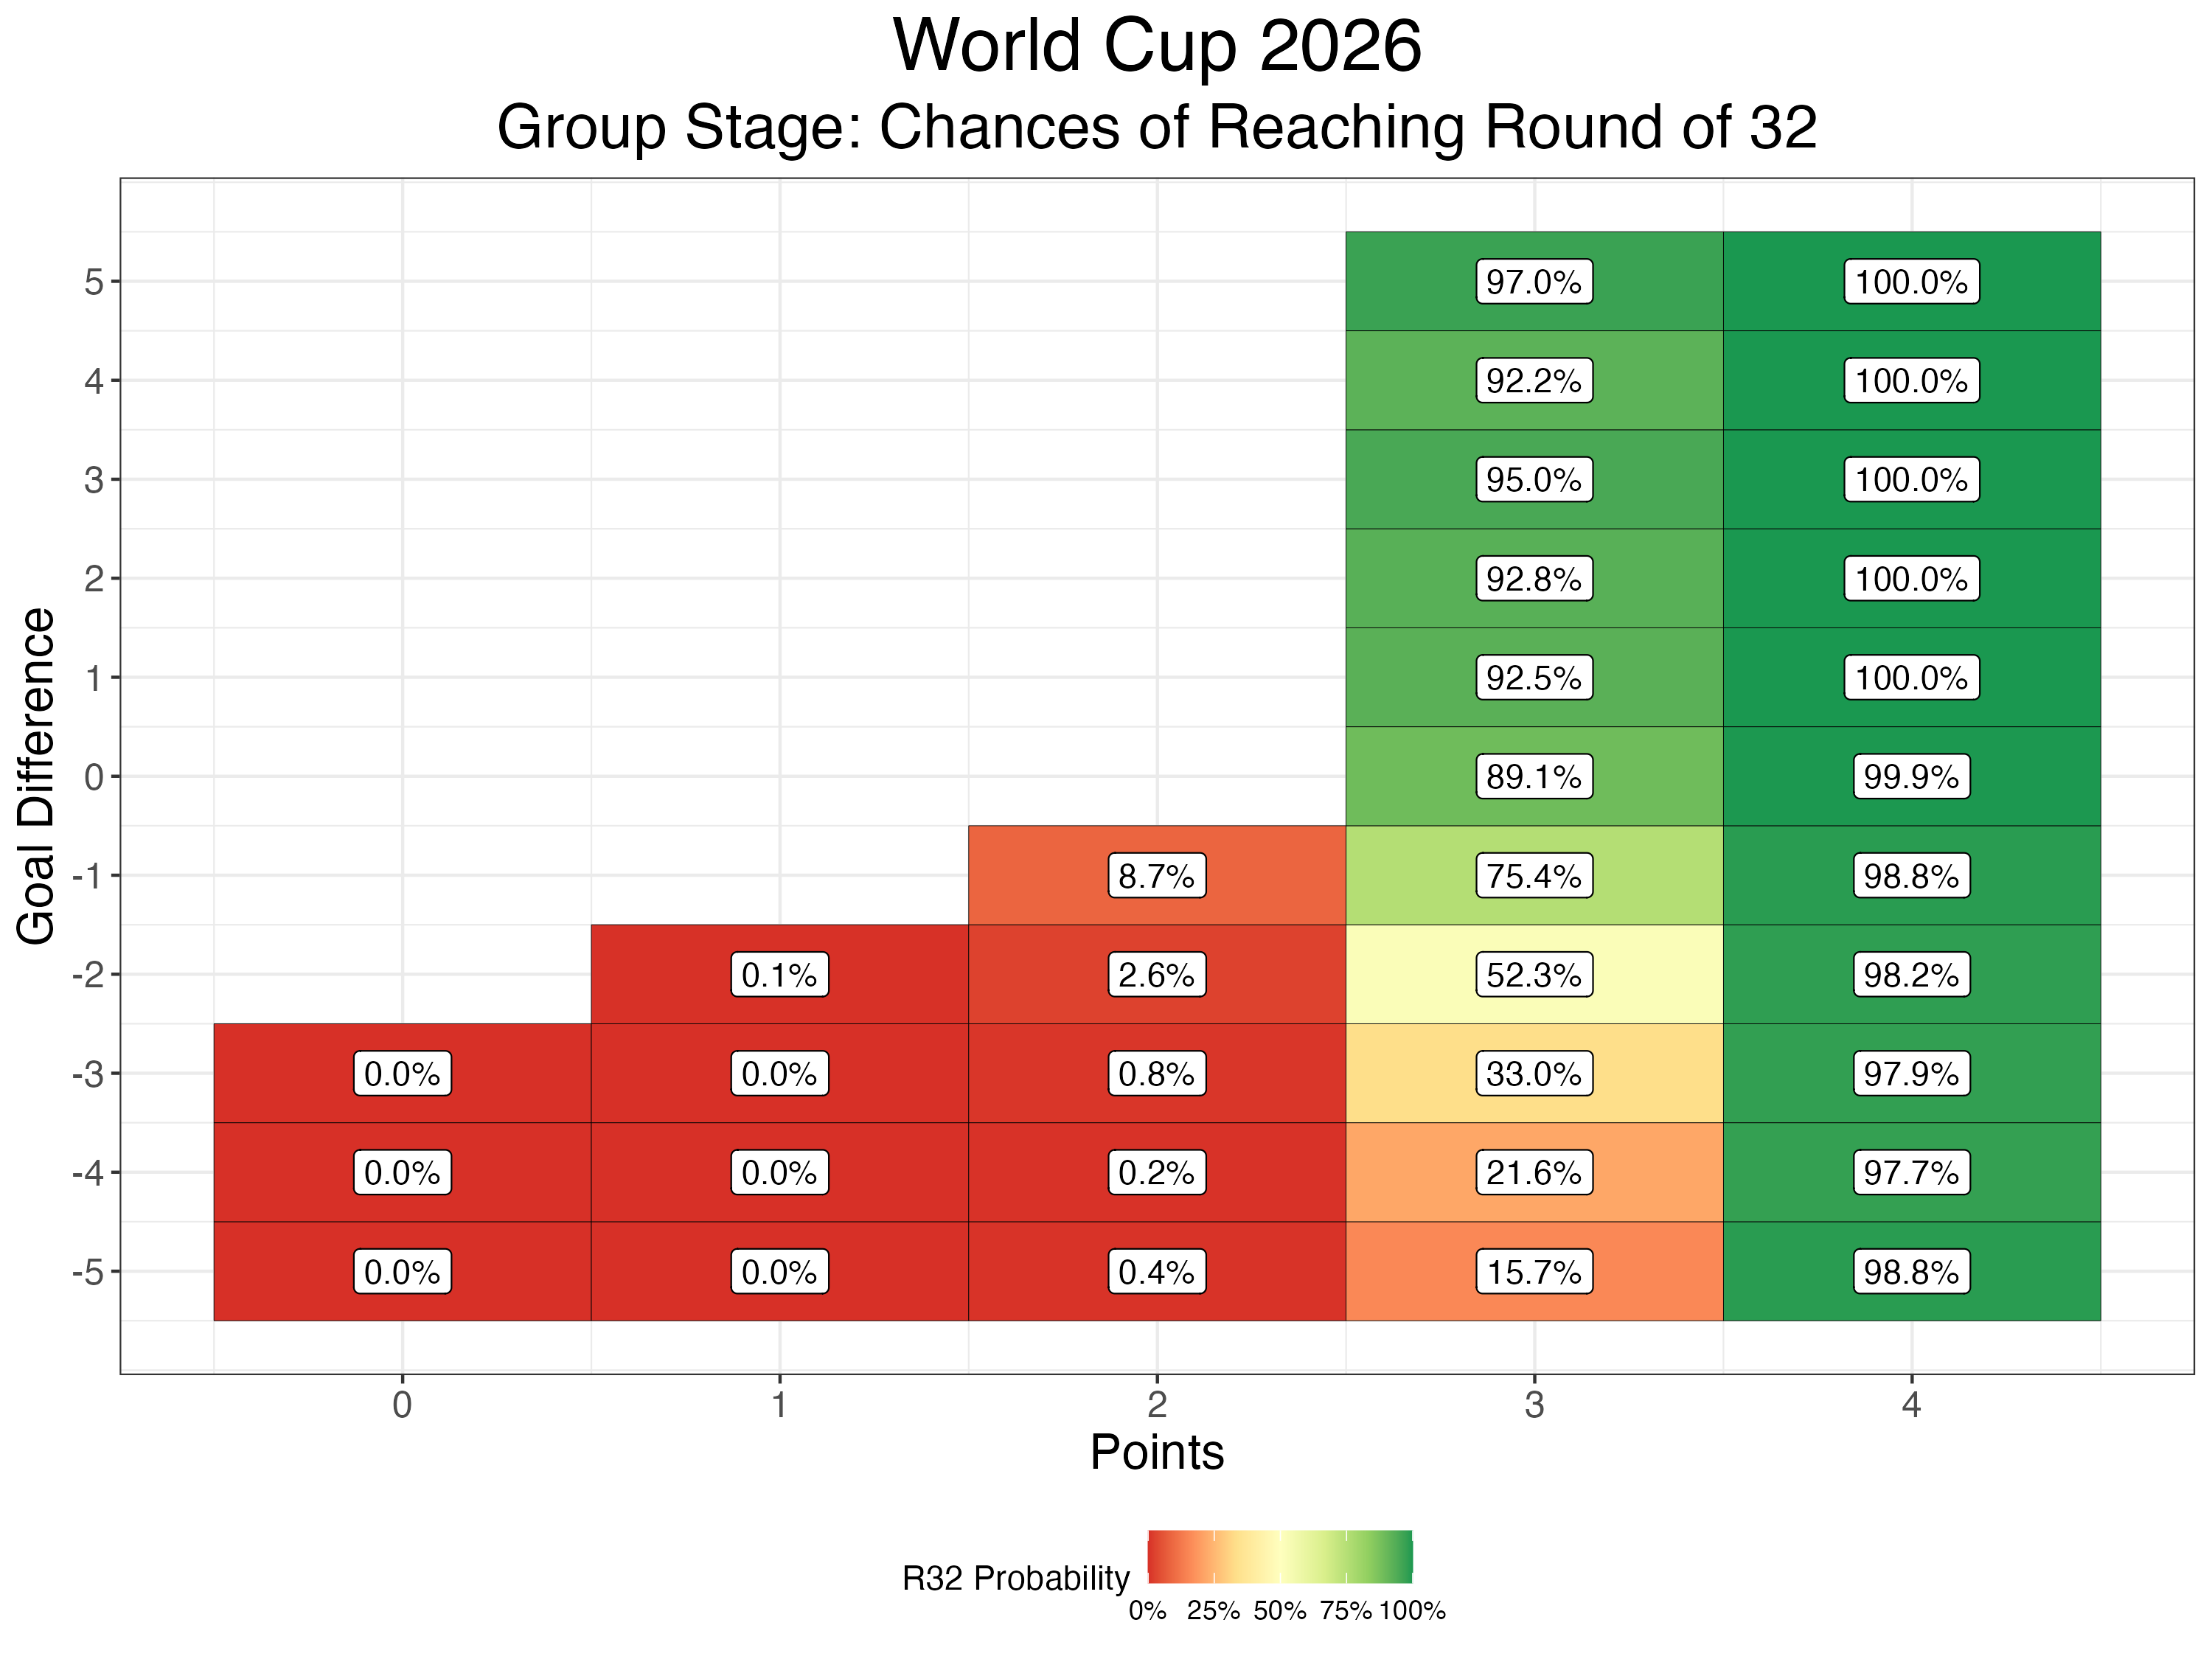
One of the unique features of the expanded 48-team format is the selection of 8 third-place teams to fill out the Round of 32. The tile below shows how a third-place team’s points and goal difference affect their chances of advancing — teams with 4 points are nearly guaranteed to go through, while a 3-point third-place finish is often sufficient, and anything fewer is a long shot.
Most Likely Knockout Matchups
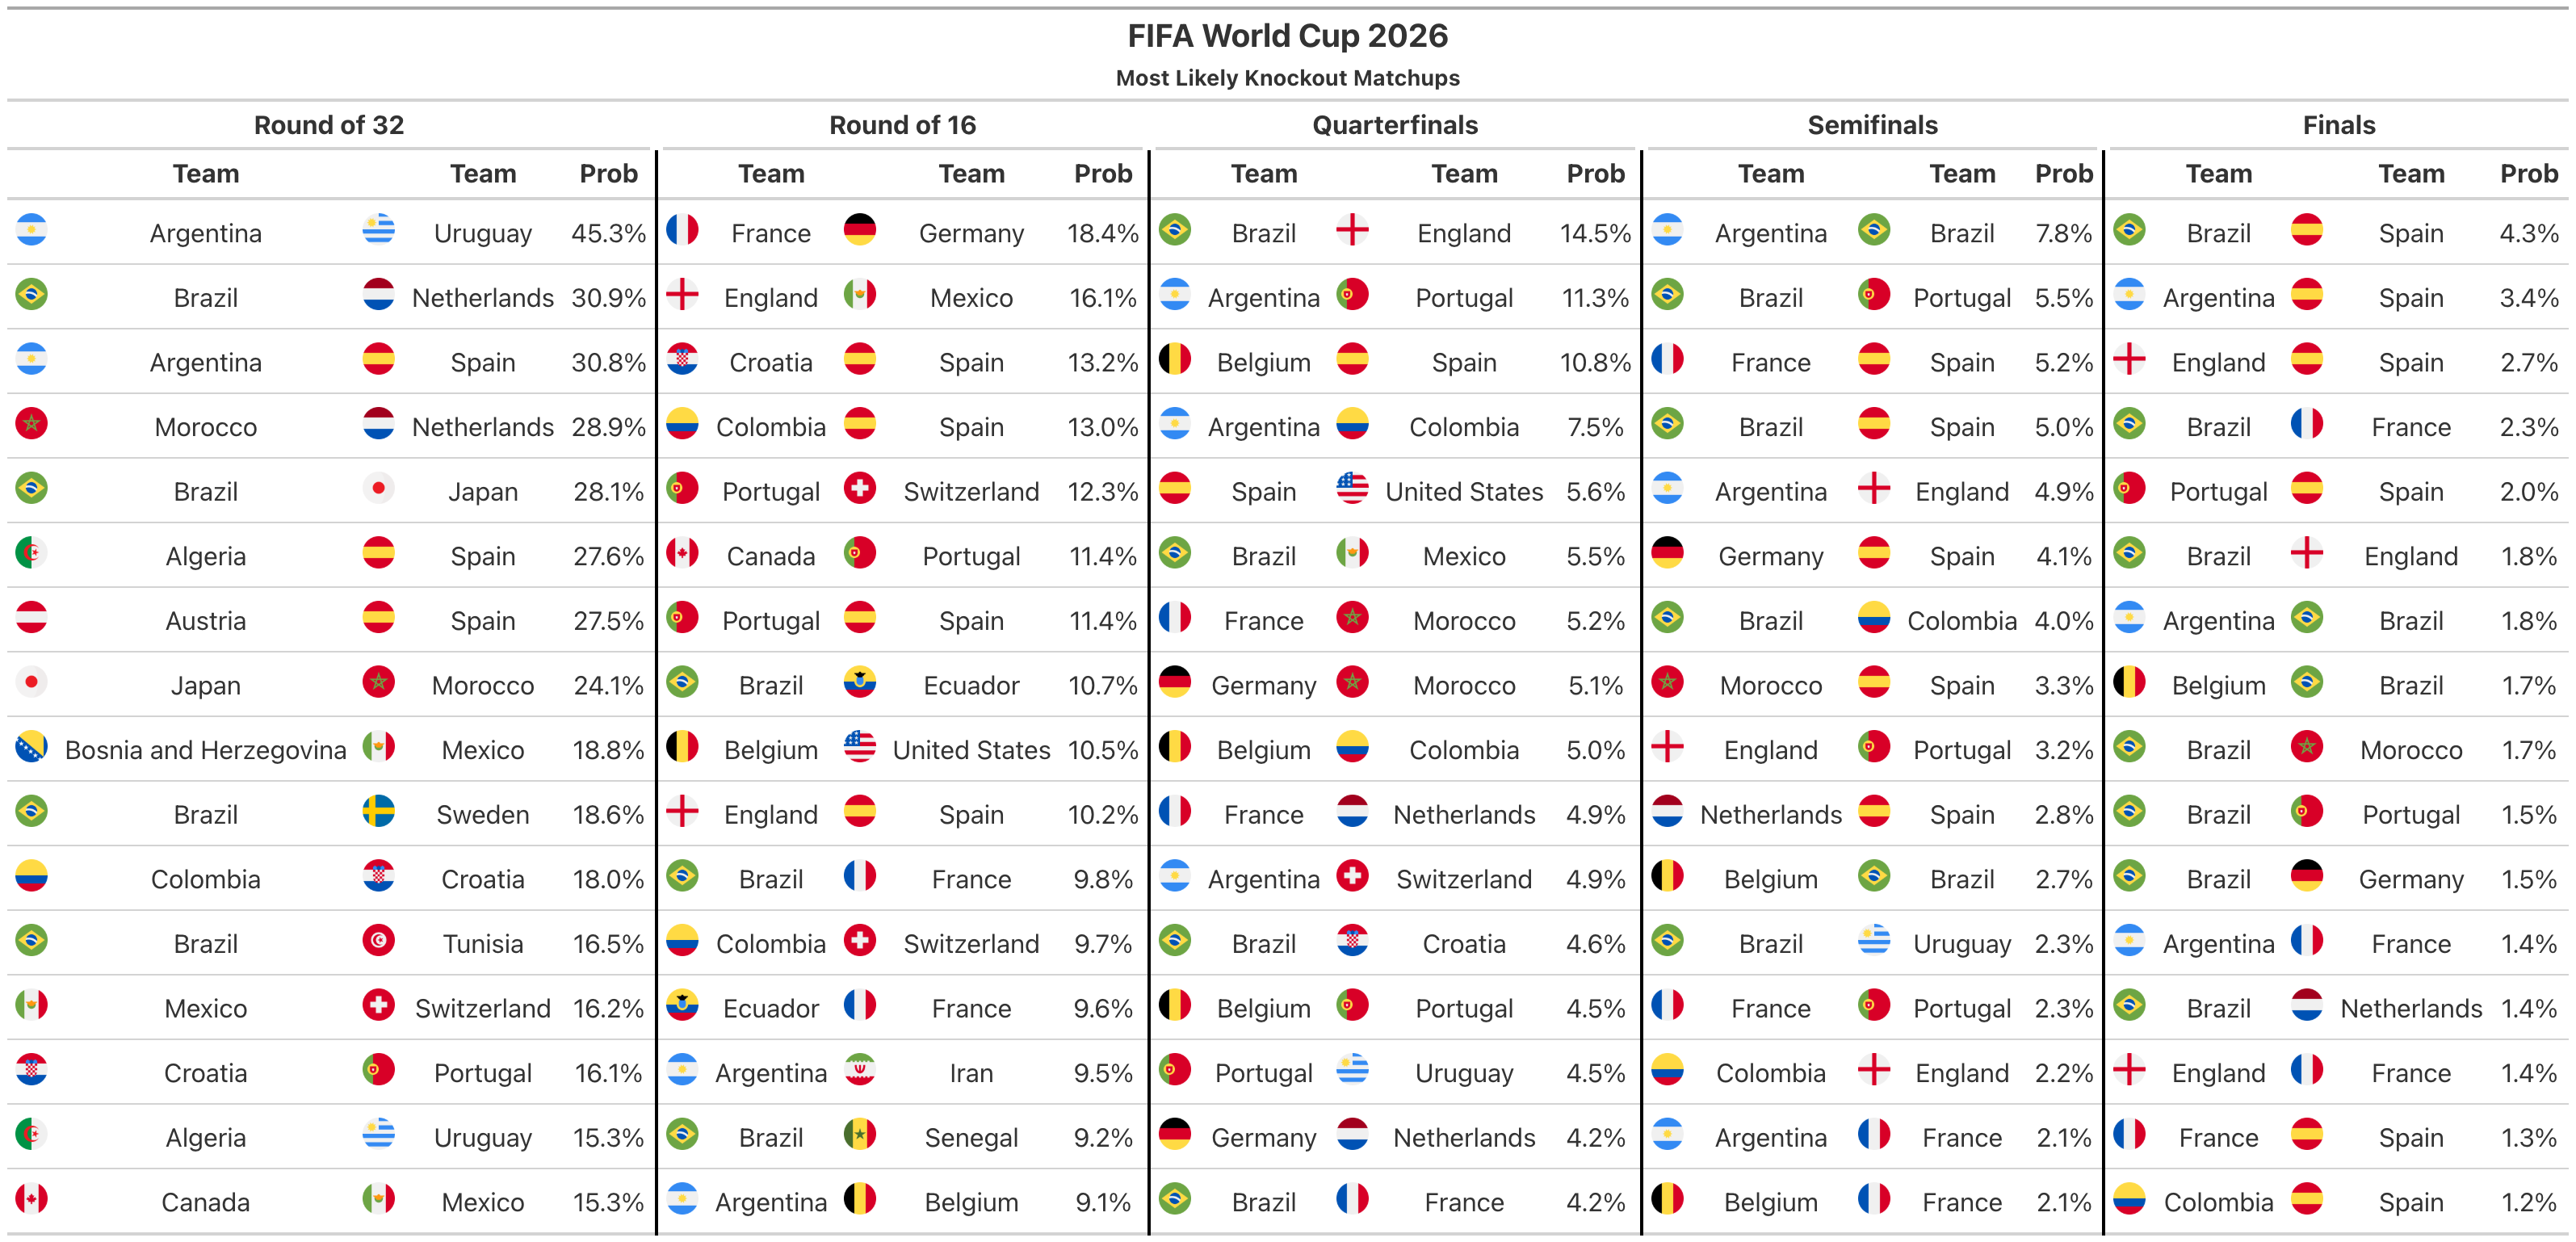
A few things worth unpacking from the matchup table above.
R32: The most striking entry is Argentina vs. Uruguay at 45.3%, by far the highest probability of any single R32 game. This isn’t a coincidence — the R32 bracket is fixed: the Group J winner always plays the Group H runner-up. Argentina is a heavy favorite to win Group J (Algeria, Austria, Jordan), and Uruguay is the clear second-best team in Group H behind Spain, so those two ends of the bracket snap together very reliably.
The same fixed-path logic explains several other high-probability R32 matchups. Spain (H1) always faces the Group J runner-up, which is most often Algeria or Austria — hence Spain–Algeria (27.6%) and Spain–Austria (27.5%) appearing side by side. Similarly, the bracket mirrors Groups C and F directly against each other: the Group C winner faces the Group F runner-up, and vice versa. Brazil is a strong favorite in Group C, Morocco is their likely runner-up, and the Group F race between Netherlands and Japan is genuinely close. When Netherlands finishes first (behind Japan), they draw Morocco; when Japan wins the group instead, Netherlands draws Brazil. That single flip drives four of the most likely R32 matchups — Brazil–Netherlands (30.9%), Brazil–Japan (28.0%), Morocco–Netherlands (29.0%), and Japan–Morocco (24.1%).
The eight R32 slots involving third-place teams introduce a layer of structural complexity not present elsewhere in the bracket. FIFA assigns advancing third-place teams to specific slots not randomly, but through a lookup table keyed on which eight of the twelve groups produced a qualifying third-place team. The same slot can receive a third-place team from Group E in one scenario and from Group K in another, depending on how the rest of the group stage plays out. As a result, the most likely matchup for a team drawing one of those slots is shaped as much by which group combination is most probable as by which teams are strong — making those matchups noticeably less predictable than the fixed-path games at the top of the list.
R16 and beyond: Once the field is down to 16, the bracket is seeded by R32 game number (winners of adjacent R32 games meet), so the best teams tend to funnel toward one another. The most likely R16 matchup is France vs. Germany (18.4%) — two teams in neighboring bracket positions — followed by England vs. Mexico (16.1%). In the quarterfinals, Brazil–England (14.5%) and Argentina–Portugal (11.4%) stand out, while the semifinals most often feature Argentina vs. Brazil (7.8%) as the marquee clash. The single most likely final is Brazil vs. Spain (4.3%), with Argentina–Spain (3.4%) close behind — a fitting potential rematch pitting the two highest-rated teams against the defending champions.
- Brazil is my model’s slight favorite at 16.7%, edging out Spain (14.9%) and Argentina (10.9%). The South American heavyweights combine elite attacking and defensive ratings, and both drew manageable groups.
- Spain enters as reigning European champions and actually carries the highest net team rating in the model, but a group containing Uruguay keeps their Group H from being a walkover, which pulls their championship probability slightly below Brazil’s.
- Argentina (10.9%) are the defending World Cup champions and drew arguably the most favorable group on paper, facing Algeria, Austria, and Jordan in Group J. Don’t expect any surprises there.
- England (8.9%) remain a top-four contender. Group L also contains Croatia, which sets up a potential rematch of the 2018 World Cup semifinal as early as the group stage.
- My model is a bit lower on France (7.0%) than the betting markets. Group I — featuring Senegal and Norway — is trickier than it looks, and France’s path to the knockout stage is not a formality.
- Portugal (6.7%) are rated very highly by the model, perhaps a touch underappreciated by the public. Their Group K draw alongside Colombia is one of the more unusual pairings of the tournament; one of those two sides will likely exit in the group stage.
- Belgium (4.1%), Colombia (4.0%), and Germany (3.7%) form a credible next tier. All three have realistic paths to the quarterfinals and beyond.
- Morocco (3.4%) are the model’s top African side but drew an extremely tough Group C alongside Brazil. Getting out of that group would be a significant achievement.
- The United States (1.4%) has a genuine, if modest, shot at a deep run as one of the three host nations. Group D — with Paraguay, Australia, and Türkiye — is competitive but winnable, and home crowd support could provide an advantage the model only partially captures.
The Model
The model used in these simulations is a slight variation of the Bayesian bivariate Poisson model (BVP) outlined in Equation (2) of (Benz and Lopez, 2021). The BVP modeling framework is as follows. Let \((Y_{ij}, Y_{ik}) \sim BVP(\lambda_{1i}, \lambda_{2i}, \lambda_{3i})\) denote the goals for two teams \(j\) vs. \(k\) in match \(i\). Under this framework, \(Y_{ij} \sim \text{Pois}(\lambda_{1i} + \lambda_{3i})\) and \(Y_{ik} \sim \text{Pois}(\lambda_{2i} + \lambda_{3i})\), where \(\lambda_{3i}\) can be viewed as a correlation term between the expected goals for the two teams in game \(i\). In our previous work, we found that empirically fitting the model with \(\lambda_3 = 0\) performs as well as or better than estimating \(\lambda_3\) from data — likely because fixing \(\lambda_3 = 0\) reduces estimator variance given the limited sample sizes in international soccer — a finding consistent with (Groll et al. 2018). Adopting this choice for this work, this reduces to a product of two independent Poisson random variables, which I model as follows:
\[ \begin{aligned} \log(\lambda_1) &= \mu + \alpha_{t[j]} + \delta_{t[k]} + \biggr(\tau_{h}\mathbb{I}(j = \text{home})~+~\tau_n\mathbb{I}(j = \text{neutral})\biggr) \\ \log(\lambda_2) &= \mu + \alpha_{t[k]} + \delta_{t[j]} + \biggr(\tau_{h}\mathbb{I}(k = \text{home})~+~\tau_n\mathbb{I}(k = \text{neutral})\biggr) \\ \end{aligned} \]
In the above,
- \(\mu\) represents the log goal expectation of an average international team playing away from home
- \(\alpha\) represents attacking team strengths
- \(\delta\) represents defensive team strengths
- \(\tau\) represents location parameters. Nearly all World Cup matches are played at neutral sites, though the three host nations get a small home boost.
Each team is assigned a posterior mean estimate for \(\alpha\) and \(\delta\) by fitting the model in Stan on international match data from 2016 onwards. Teams require a minimum of 20 matches in that window to receive a direct rating; otherwise a weak prior pulls them toward the mean.
As with prior iterations of this model, I use a weighted log-likelihood to account for the fact that international teams don’t play many games and not all games carry equal meaning. Each match is weighted as:
\[ w_i = b_i\exp\biggr(-\frac{T_\max - T_i}{T_\max-T_\min}\biggr) \]
- \(b_i\) is the base weight for game \(i\): 1 for friendlies, 1.25 for Nations League matches, 2 for continental championships, and 2.5 for World Cup matches.
- \(T_i\) is the date of game \(i\)
- \(T_\min\) and \(T_\max\) are the earliest and latest games in the sample
The \(\exp(\cdot)\) term decays weights so that more recent games count more than older ones. The parameters \(T_\min\) and \(b_i\) are tunable and chosen somewhat arbitrarily here; cross-validation would be the right approach for optimizing them with more time. I fit the model in Stan — see the code linked below for prior choices and other fitting details.
Limitations
Modeling international soccer is genuinely hard. A few of the challenges worth keeping in mind when interpreting these predictions:
Limited sample sizes. International teams play far fewer matches than club sides — on the order of 10–15 competitive games per year, and many fewer for smaller nations. Teams like Curaçao, Cape Verde, or Haiti (all group stage participants) have limited data against quality opposition, so model uncertainty for these sides is high. The predictions treat posterior means as point estimates in simulation, which understates true uncertainty.
Friendly game devaluation is imperfect. The weighting scheme discounts friendlies, but the distinction between a “serious” friendly and a competitive warm-up is blurry in practice. Top teams routinely rest starters in friendlies regardless of the opponent or occasion, which means those results carry less signal than the framework assumes. There is no perfect solution here.
Home/neutral site advantage is coarse. The model estimates a single neutral site parameter (\(\hat{\tau}_n \approx 0.22\)) applied to all matches in the United States, Canada, and Mexico equally. In reality, the US team is likely to enjoy something closer to a genuine home advantage given the expected crowd composition, while Canada and Mexico may benefit similarly in games near their borders. A single parameter cannot distinguish these cases.
The 48-team format is unprecedented. This is the first World Cup with 48 teams and the first with a Round of 32. The rule that selects the eight best third-place teams involves a complex cross-group comparison of points, goal difference, and goals scored. There is no historical precedent to validate whether simulation of this stage works as expected at scale; the tiebreaker rules introduce combinatorial complexity that can produce counterintuitive results.
Tournament-specific form is unobserved. The model is fit on pre-tournament data and treats those ratings as fixed throughout group play. In reality, injuries, player availability, tactical adaptations, and squad peaking (or fatigue from a long club season) all matter enormously in tournament soccer — and none of it is captured here.
Within-game correlation is ignored. Setting \(\lambda_3 = 0\) treats each team’s goals as independent within a match. Empirically this is well-supported, but it misses real within-game dynamics: a team trailing by a goal tends to take more risks, which can inflate scoring for both sides. The practical effect on tournament-level predictions is likely small but non-zero.