Below is my submission methodology for the 2019 American Statistical Association Statsketball Draft Challenge. Having won the contest in 2018, I knew that I had to up my game this year to defend my crown.
Contest Background
The Statsketball Draft Challenge asks participants the chance to select NCAA Tournament Teams using a budget of 224 draft points. The cost of each team, in draft points, is based on the team’s seed.
| seed | cost |
|---|---|
| 1 | 75 |
| 2 | 40 |
| 3 | 25 |
| 4 | 20 |
| 5 | 17 |
| 6 | 15 |
| 7 | 12 |
| 8 | 10 |
| 9 | 9 |
| 10 | 8 |
| 11 | 7 |
| 12 | 6 |
| 13 | 5 |
| 14 | 4 |
| 15 | 3 |
| 16 | 1 |
The deeper each team goes in the tournanement, the more points they accrue, with each round more valuable than the last. Wins in each round are worth 1, 2, 3, 5, 8, and 13 points, respectively. The goal of the contest is to score the most points by selecting a subset a group of teams within the alloted budget.
Methodology
NCAA Hoops Model
A key ingredient to my submission is the NCAA men’s basketball model that I have developed over the last 3 years. In very simple terms, the model using weighted least squares regression to predict score differentials between any two teams, and then utilizes logistic regression to transform the obtained pointspread into a win probability for each team. The specifics of this model are not the primary focus of the Statsketball tournament submission, but for those curious, a detailed write-up of the model methodology can be found here. For the purposes of this contest, all that is important is knowing is that given teams \(A\) and \(B\), the model outputs, \(P_A\) and \(P_B\), the chances that team \(A\) and team \(B\) win the game, respectively.
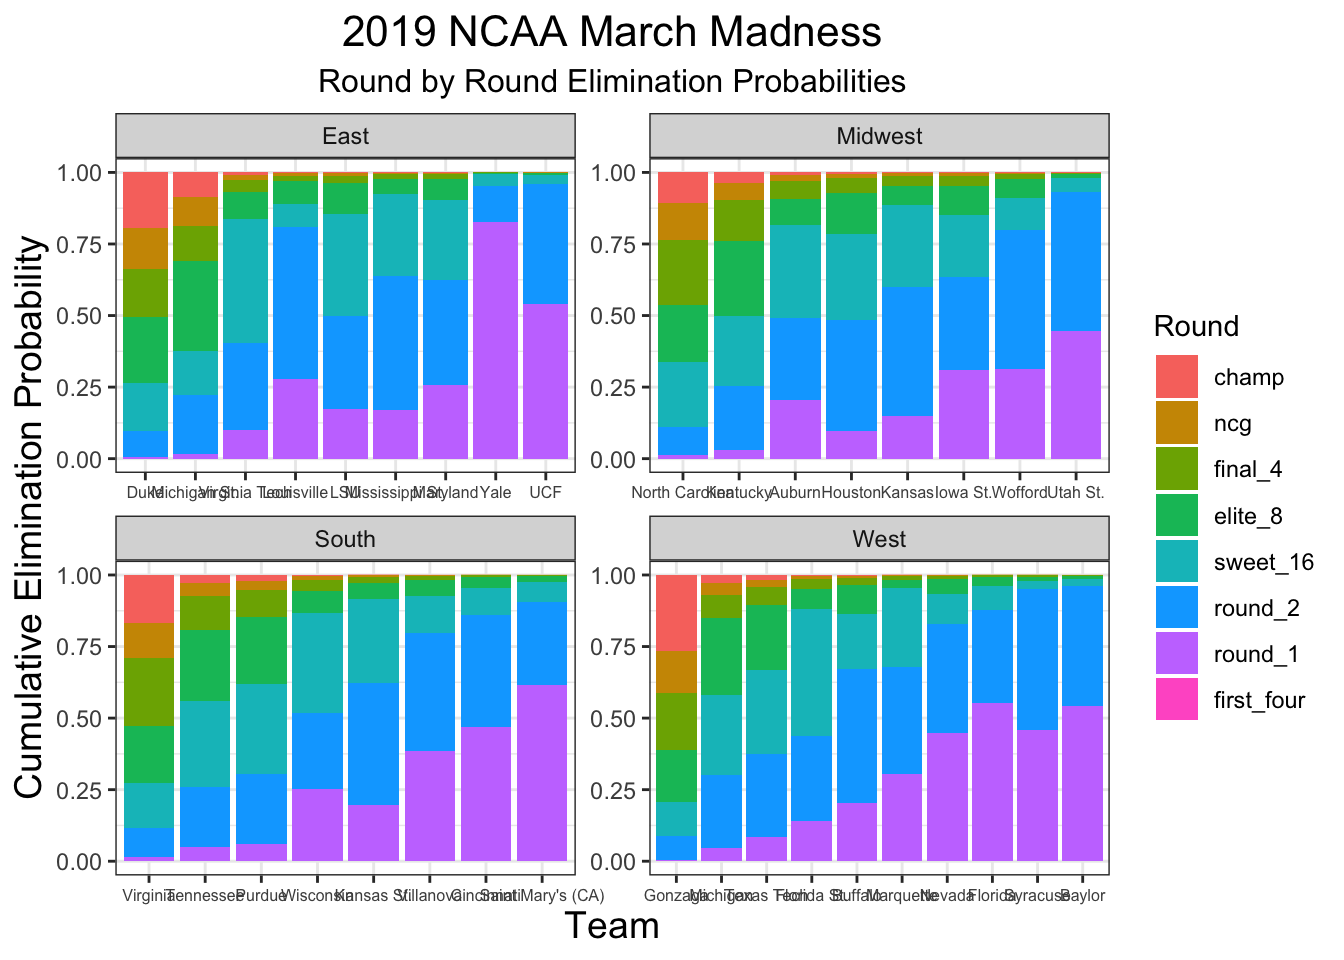
Simulating the NCAA Tournament
The second step in my submission invloved running Monte Carlo simulations of the NCAA tournament. A single simulation of the tournament used the following steps
- Use NCAA Hoops Model to predict the win probabilities for all 32 games in first round.
- Draw 32 random numbers from a uniform distribution, one for each game.
- Let game \(i\) be played between team \(A_i\) and team \(B_i\) If the \(i^{th}\) random number is \(\leq\) team \(A_i\)’s chances of winning, advance team \(A_i\) to the next round. Otherwise, advance team \(B_i\) to the next round.
- Repeat step 3 for all games in given round.
- Repeat setps 1-4 for subsequent rounds, until a champion is crowned.
I ran 10,000 simulations of the NCAA tournament to obtain estimates of the probabilities of each team reaching each round. R code for running these simulations can be found here. The results of my simulations are shown below.
| team | seed | region | r64 | r32 | s16 | e8 | f4 | ncg | champ |
|---|---|---|---|---|---|---|---|---|---|
| Gonzaga | 1 | West | 1.0000 | 0.9954 | 0.9133 | 0.7932 | 0.6129 | 0.4113 | 0.2653 |
| Duke | 1 | East | 1.0000 | 0.9928 | 0.9036 | 0.7341 | 0.5039 | 0.3367 | 0.1928 |
| Virginia | 1 | South | 1.0000 | 0.9866 | 0.8822 | 0.7261 | 0.5267 | 0.2890 | 0.1682 |
| North Carolina | 1 | Midwest | 1.0000 | 0.9889 | 0.8877 | 0.6631 | 0.4617 | 0.2354 | 0.1081 |
| Michigan St. | 2 | East | 1.0000 | 0.9824 | 0.7774 | 0.6230 | 0.3082 | 0.1867 | 0.0870 |
| Kentucky | 2 | Midwest | 1.0000 | 0.9695 | 0.7446 | 0.5019 | 0.2380 | 0.0954 | 0.0362 |
| Michigan | 2 | West | 1.0000 | 0.9549 | 0.7001 | 0.4205 | 0.1518 | 0.0688 | 0.0276 |
| Tennessee | 2 | South | 1.0000 | 0.9508 | 0.7411 | 0.4412 | 0.1914 | 0.0728 | 0.0275 |
| Purdue | 3 | South | 1.0000 | 0.9398 | 0.6942 | 0.3801 | 0.1453 | 0.0517 | 0.0193 |
| Texas Tech | 3 | West | 1.0000 | 0.9165 | 0.6242 | 0.3324 | 0.1060 | 0.0427 | 0.0160 |
| Auburn | 5 | Midwest | 1.0000 | 0.7955 | 0.5087 | 0.1826 | 0.0935 | 0.0312 | 0.0093 |
| Virginia Tech | 4 | East | 1.0000 | 0.9012 | 0.5951 | 0.1621 | 0.0678 | 0.0277 | 0.0080 |
| Houston | 3 | Midwest | 1.0000 | 0.9020 | 0.5159 | 0.2142 | 0.0721 | 0.0193 | 0.0056 |
| Wisconsin | 5 | South | 1.0000 | 0.7462 | 0.4815 | 0.1321 | 0.0573 | 0.0158 | 0.0042 |
| Florida St. | 4 | West | 1.0000 | 0.8603 | 0.5624 | 0.1190 | 0.0493 | 0.0144 | 0.0040 |
| Buffalo | 6 | West | 1.0000 | 0.7971 | 0.3297 | 0.1366 | 0.0336 | 0.0110 | 0.0033 |
| Louisville | 7 | East | 1.0000 | 0.7231 | 0.1890 | 0.1093 | 0.0288 | 0.0110 | 0.0033 |
| LSU | 3 | East | 1.0000 | 0.8281 | 0.5024 | 0.1455 | 0.0378 | 0.0121 | 0.0030 |
| Kansas | 4 | Midwest | 1.0000 | 0.8524 | 0.3988 | 0.1145 | 0.0476 | 0.0111 | 0.0020 |
| Iowa St. | 6 | Midwest | 1.0000 | 0.6897 | 0.3652 | 0.1494 | 0.0486 | 0.0123 | 0.0017 |
| Kansas St. | 4 | South | 1.0000 | 0.8050 | 0.3783 | 0.0852 | 0.0297 | 0.0061 | 0.0015 |
| Marquette | 5 | West | 1.0000 | 0.6964 | 0.3216 | 0.0455 | 0.0161 | 0.0035 | 0.0013 |
| Mississippi St. | 5 | East | 1.0000 | 0.8290 | 0.3609 | 0.0747 | 0.0233 | 0.0063 | 0.0010 |
| Wofford | 7 | Midwest | 1.0000 | 0.6854 | 0.2001 | 0.0909 | 0.0237 | 0.0056 | 0.0009 |
| Villanova | 6 | South | 1.0000 | 0.6152 | 0.2016 | 0.0725 | 0.0179 | 0.0029 | 0.0006 |
| Nevada | 7 | West | 1.0000 | 0.5528 | 0.1717 | 0.0652 | 0.0127 | 0.0026 | 0.0006 |
| Maryland | 6 | East | 1.0000 | 0.7421 | 0.3775 | 0.0956 | 0.0215 | 0.0057 | 0.0005 |
| Utah St. | 8 | Midwest | 1.0000 | 0.5534 | 0.0668 | 0.0184 | 0.0041 | 0.0009 | 0.0003 |
| Cincinnati | 7 | South | 1.0000 | 0.5308 | 0.1392 | 0.0442 | 0.0078 | 0.0014 | 0.0002 |
| Yale | 14 | East | 1.0000 | 0.1719 | 0.0457 | 0.0044 | 0.0005 | 0.0002 | 0.0002 |
| Florida | 10 | West | 1.0000 | 0.4472 | 0.1223 | 0.0390 | 0.0064 | 0.0014 | 0.0001 |
| Syracuse | 8 | West | 1.0000 | 0.5412 | 0.0490 | 0.0193 | 0.0063 | 0.0013 | 0.0001 |
| Saint Mary’s (CA) | 11 | South | 1.0000 | 0.3848 | 0.0944 | 0.0259 | 0.0039 | 0.0007 | 0.0001 |
| UCF | 9 | East | 1.0000 | 0.4608 | 0.0406 | 0.0099 | 0.0020 | 0.0005 | 0.0001 |
| Baylor | 9 | West | 1.0000 | 0.4588 | 0.0377 | 0.0130 | 0.0031 | 0.0004 | 0.0001 |
| Iowa | 10 | South | 1.0000 | 0.4692 | 0.1131 | 0.0352 | 0.0064 | 0.0007 | 0.0000 |
| VCU | 8 | East | 1.0000 | 0.5392 | 0.0557 | 0.0165 | 0.0032 | 0.0007 | 0.0000 |
| Oklahoma | 9 | South | 1.0000 | 0.5250 | 0.0609 | 0.0220 | 0.0055 | 0.0006 | 0.0000 |
| Ole Miss | 8 | South | 1.0000 | 0.4750 | 0.0549 | 0.0194 | 0.0054 | 0.0006 | 0.0000 |
| Washington | 9 | Midwest | 1.0000 | 0.4466 | 0.0445 | 0.0108 | 0.0019 | 0.0003 | 0.0000 |
| Minnesota | 10 | East | 1.0000 | 0.2769 | 0.0324 | 0.0128 | 0.0016 | 0.0003 | 0.0000 |
| Ohio St. | 11 | Midwest | 1.0000 | 0.3103 | 0.1036 | 0.0275 | 0.0045 | 0.0002 | 0.0000 |
| Seton Hall | 10 | Midwest | 1.0000 | 0.3146 | 0.0522 | 0.0149 | 0.0021 | 0.0002 | 0.0000 |
| Murray St. | 12 | West | 1.0000 | 0.3036 | 0.0836 | 0.0079 | 0.0011 | 0.0002 | 0.0000 |
| Oregon | 12 | South | 1.0000 | 0.2538 | 0.1059 | 0.0124 | 0.0024 | 0.0001 | 0.0000 |
| New Mexico St. | 12 | Midwest | 1.0000 | 0.2045 | 0.0705 | 0.0090 | 0.0021 | 0.0001 | 0.0000 |
| Temple | 11 | East | 0.4049 | 0.0883 | 0.0199 | 0.0018 | 0.0003 | 0.0001 | 0.0000 |
| Belmont | 11 | East | 0.5951 | 0.1696 | 0.0545 | 0.0074 | 0.0009 | 0.0000 | 0.0000 |
| Vermont | 13 | West | 1.0000 | 0.1397 | 0.0324 | 0.0021 | 0.0005 | 0.0000 | 0.0000 |
| UC Irvine | 13 | South | 1.0000 | 0.1950 | 0.0343 | 0.0024 | 0.0003 | 0.0000 | 0.0000 |
| Arizona St. | 11 | West | 0.5599 | 0.1223 | 0.0192 | 0.0033 | 0.0001 | 0.0000 | 0.0000 |
| Liberty | 12 | East | 1.0000 | 0.1710 | 0.0251 | 0.0018 | 0.0001 | 0.0000 | 0.0000 |
| Northern Ky. | 14 | West | 1.0000 | 0.0835 | 0.0145 | 0.0012 | 0.0001 | 0.0000 | 0.0000 |
| Georgia St. | 14 | Midwest | 1.0000 | 0.0980 | 0.0153 | 0.0010 | 0.0001 | 0.0000 | 0.0000 |
| Saint Louis | 13 | East | 1.0000 | 0.0988 | 0.0189 | 0.0009 | 0.0001 | 0.0000 | 0.0000 |
| Northeastern | 13 | Midwest | 1.0000 | 0.1476 | 0.0220 | 0.0016 | 0.0000 | 0.0000 | 0.0000 |
| St. John’s (NY) | 11 | West | 0.4401 | 0.0806 | 0.0124 | 0.0009 | 0.0000 | 0.0000 | 0.0000 |
| Montana | 15 | West | 1.0000 | 0.0451 | 0.0059 | 0.0009 | 0.0000 | 0.0000 | 0.0000 |
| Old Dominion | 14 | South | 1.0000 | 0.0602 | 0.0098 | 0.0006 | 0.0000 | 0.0000 | 0.0000 |
| Gardner-Webb | 16 | South | 1.0000 | 0.0134 | 0.0020 | 0.0004 | 0.0000 | 0.0000 | 0.0000 |
| Colgate | 15 | South | 1.0000 | 0.0492 | 0.0066 | 0.0003 | 0.0000 | 0.0000 | 0.0000 |
| Abilene Christian | 15 | Midwest | 1.0000 | 0.0305 | 0.0031 | 0.0002 | 0.0000 | 0.0000 | 0.0000 |
| Bradley | 15 | East | 1.0000 | 0.0176 | 0.0012 | 0.0002 | 0.0000 | 0.0000 | 0.0000 |
| Iona | 16 | Midwest | 1.0000 | 0.0111 | 0.0010 | 0.0000 | 0.0000 | 0.0000 | 0.0000 |
| North Dakota St. | 16 | East | 0.7344 | 0.0061 | 0.0001 | 0.0000 | 0.0000 | 0.0000 | 0.0000 |
| N.C. Central | 16 | East | 0.2656 | 0.0011 | 0.0000 | 0.0000 | 0.0000 | 0.0000 | 0.0000 |
| Fairleigh Dickinson | 16 | West | 0.5314 | 0.0025 | 0.0000 | 0.0000 | 0.0000 | 0.0000 | 0.0000 |
| Prairie View | 16 | West | 0.4686 | 0.0021 | 0.0000 | 0.0000 | 0.0000 | 0.0000 | 0.0000 |
Expected Points
Now that we have probabilities that each team reaches each round in the tournament, we can compute the expected number of points a given team will score. Let \(S_i\) denote the number of points team \(i\) will score in the Statsketball tournament. We see that the expected number of points team \(i\) will score, \(\mathbb{E}(W_i)\) is computed as follows:
\[
\mathbb{E}(S_i) = \sum_{j = 1}^6 P(\text{Team } i \text{ wins in Round } j)\times(\text{Points for win in Round } j)
\]
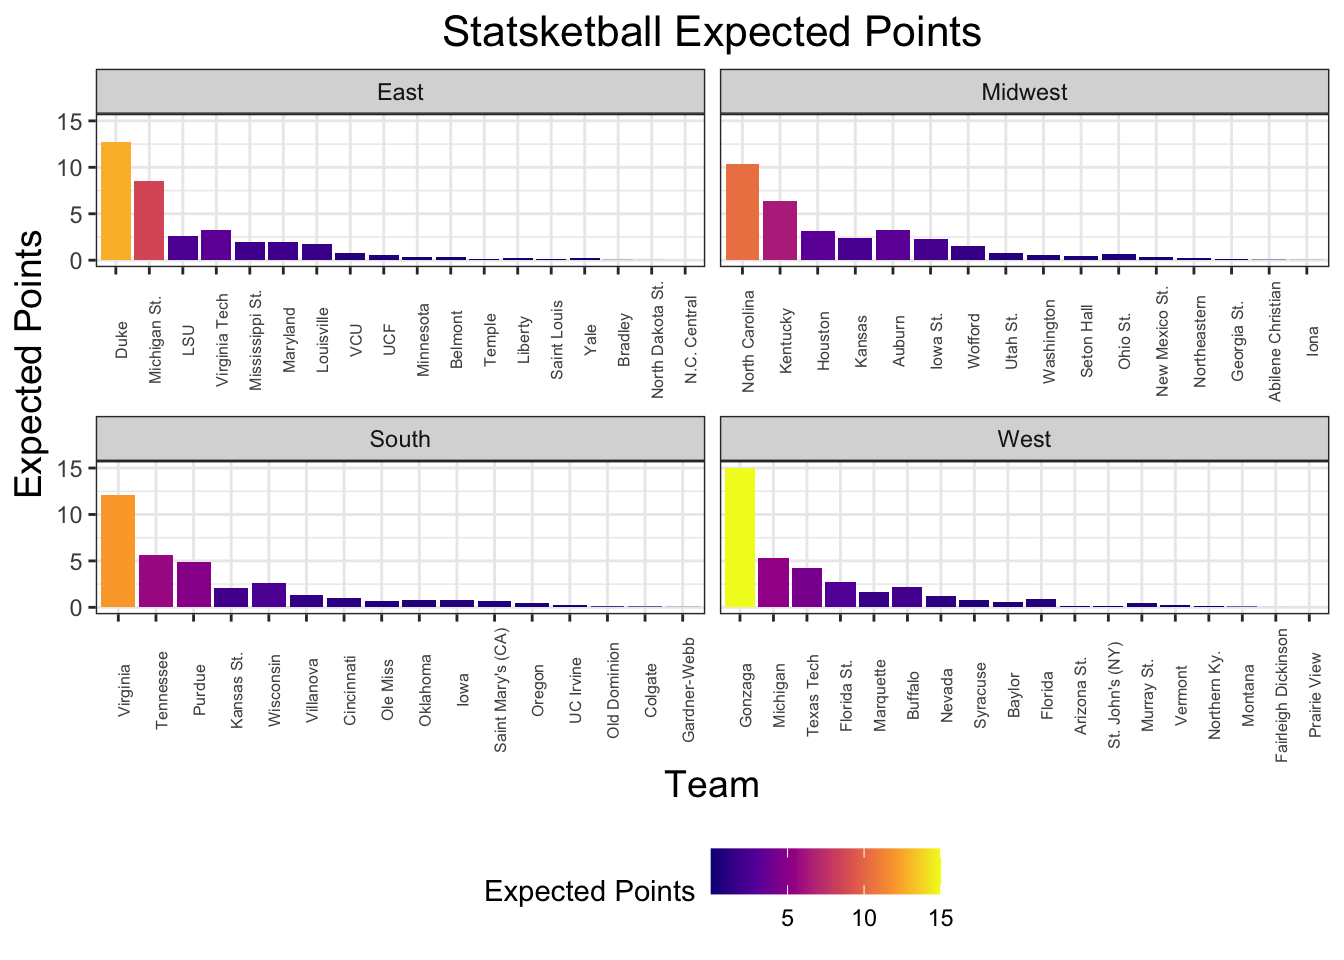 It’s not suprising that teams with better seeds tend to have the best expected points. However, given the increased cost, is it necessarily worth it? Looking at a plot of expected points divided by team cost (to get an estimate of how many points we can expected per draft point we spend), it’s clear that many of the 1-seeds, with the expection of Gonzaga, are overvalued.
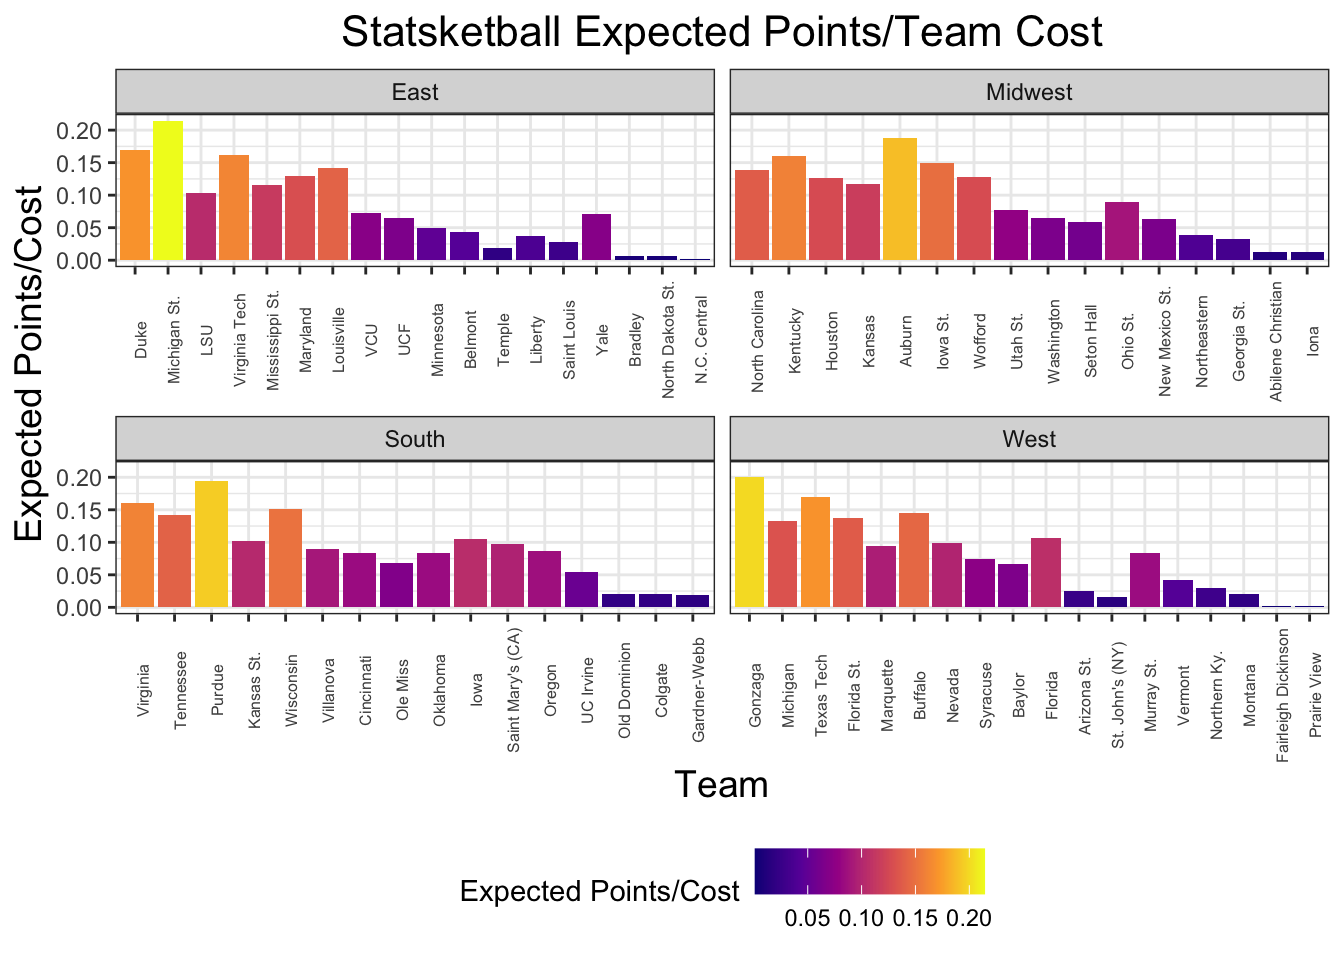
Selecting Teams: The Knapsack Problem
I’d like to select the teams that maximize the number of expected points in my entry, subject to the budget restriction. This is a version of the classic, Knapsack Problem. In the Knapsack Problem, there are \(N\) objects with values \(p_1, ..., p_n\) and weights \(w_1, ..., w_n\). The problem asks for the most valuable subset of objects that can fit in the backpack, which has weight capacity \(C\). In the context of Statsketball, the objects are the teams, values \(p_i\) are equal to the expected points scored \(\mathbb{E}(S_i)\), weights \(w_i\) are equal to team costs, and the capacity \(C\) is our budget of 224 draft points. The Knapsack problem is solved using Dynamic Programming, and there is an implementation of a Knapsack solver in the adagio R package. Note, that we will have to combine the expected points of the First 4 teams because the contest rules only asks that we select the combination of teams in each play-in game slot.
library(adagio)
kn_solved <- knapsack(ncaa_sims$cost, ncaa_sims$exp_pts, 224)
kn_solved
## $capacity
## [1] 224
##
## $profit
## [1] 42.297
##
## $indices
## [1] 2 18 21 32 35 48 49 51ncaa_sims$team[kn_solved$indices]## [1] "Michigan St." "Kentucky" "Auburn" "Iona" "Purdue"
## [6] "Gardner-Webb" "Gonzaga" "Texas Tech"We aren’t expecting much from either of the 16 seeds, Gardner-Webb and Iona, but those are simply chosen in order to not be wasteful. Not suprisingly, the teams chosen are among the best value picks in seeds 1-5 identified above.
Limitations
There are two main limitations of maximizing expected points. The first, is that we don’t know what teams other entrants to the Statsketball tournament are selecting. Any team that is selected by several entrants becomes relatively less valuable. Another limitation is that maximizing expected points yields fewer teams chosen. Many times, we can obtain 90% of the expected points of 1 team for the same (or lower) cost using some combination of 2 or 3 teams. Having lots of teams sounds great in practice, as we keep more doors open in case of upsets, but at the same time, the lower seeded a team is, the less likely it is to exceed it’s expected value. Many distributions of team points in statsketball will be heavily skewed towards 0, as lower seeded teams are likely to be knocked out in round 1 of the tournament. Because we are comparing means and not distributions, there might be some other combination of teams with a lower expected value that is more likely to outscore the group of teams I’ve selected.
By no means is this method perfect, but I think it does a reasonably good job of identifying and selecting undervalued teams given the cost constraints of the tournament.